4.12 SPECIAL MENU
- 4.12.1 about special functions (general comments)
- 4.12.2 SAGE programs (serial analysis of gene expression)
- 4.12.2.1 extraction of sage tags
- 4.12.2.2 sage tools
- 4.12.2.3 expression analysis
- 4.12.2.4 sage tag search function
- 4.12.3 microarray tools (oligonucleotide based microarrays)
- 4.12.4 multi-record text file parser
 4.12.1 about special functions
The Special functions menu include two sets of functions for analyses of gene expression:
(1) The SAGE (serial analysis of gene expression) method basically
relies on counting the number of mRNA molecules for each expressed gene. The SAGE method does not require any
knowledge about the genes and may therefore be used to quantify expression of new genes as well as of known
genes. (2) The microarray method on the other hand requires previous knowledge of the genes to be analysed.
The functions described below for microarray expression analysis are designed for oligonucleotide based custom
designed microarrays.

 4.12.2 SAGE programs
The SAGE programs include three functions for extraction, processing and analysing sage tags. In
addition a search function for searching project sequences for sage tag sequences.

The SEQtools SAGE programs were originally developed to characterise the Blumeria graminis genome and its expression patterns at different time points during spore germination as described in the two papers below. You can read more about the SAGE method at the SAGE homepage.
(1) Thomas, S.W., Glaring, M.A., Rasmussen, S.W., Kinane, J.T. and Oliver, R.P. Transcript profiling during development of the obligate plant pathogen Blumeria graminis using serial analysis of gene expression (SAGE). Mol. Plant-Microbe Interact. 15, 847-856, 2002 (2) Thomas, S.W., Rasmussen, S.W., Glaring, M.A., Rouster, J.A., Christiansen, S.K. and Oliver, R.P. Gene identification in the obligate fungal pathogen Blumeria graminis by expressed sequence tag analysis. Fungal Genet. Biol. 33, 195-211, 2001
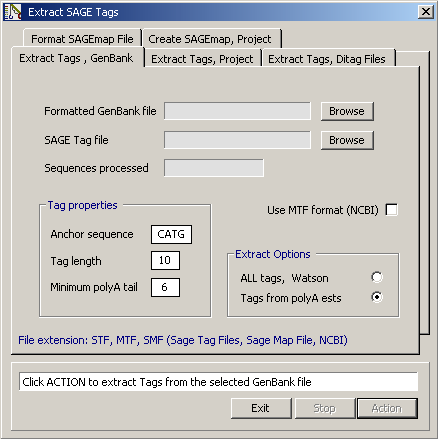
4.12.2.1 Extraction of sage tags - This form includes three programs for extracting SAGE tags from various
types of sequence files: (1) Genbank files, (2) sequences included in a SEQtools project and (3) Ditag sequence
files contained in a project. In addition there is one program for creating SAGEmap files.
Extract from Genbank - This function extracts SAGE tags from a formatted and trimmed Genbank file with the
extension *.tgf or *.ngf. The SAGE tags are extracted by the following criteria: The
sequence is searched within the 2500 3' most characters (in cases where the sequence is
longer) until the Anchor site closest to the 3' end is located. Then a SAGE tag of the
specified length is extracted. When all sequences have been extracted, the tag list is
processed including duplicate tags in the first occurrence of the tag as illustrated in
the example file shown below.
You can limit extraction to sequences that include a polyA tail or extract all
sequences. Sequences with a leading 5' polyT region are always complemented if the number
of leading T's exceed that specified by the user.
It is possible to generate A SAGEmap reliable mapping file (*.smf) for tag
identification simultaneously with the extraction of tags.
Note that the user defined tag length does not include the length of the anchor
sequence, usually 4 bases. The extension of the SAGE tag file is *.stf (sage tag file).
Also note that you can build a Genbank file yourself without first loading the
sequences into a project. Just collect the sequences in the same directory and use the
Multi-sequence Functions to build the
Genbank multi-sequence file. This feature allows you to build very large tag files without having to
load the sequences into a project.
Extract from current project - This function works in the same way as the Extract from Genbank function
except that the sequences to be extracted must be loaded into a SEQtools project before they can be
extracted.
In addition to the tag file (*.stf), this function produces two more files, one (*.lst)
including a list of sequences not yielding a SAGE tag and a second file (*.psg) which can
be used to open a project including all sequences yielding a SAGE tag.
You can limit extraction to sequences that include a polyA tail or extract all
sequences. Sequences with a leading 5' polyT region are always complemented if the number
of leading T's exceed that specified by the user.
It is possible to generate A SAGEmap reliable mapping file (*.smf) for tag
identification simultaneously with the extraction of tags. As the mapping information is
retrieved from the sequence headers, this only works if the sequences are annotated.
Note that the user defined tag length does not include the length of the anchor
sequence, usually 4 bases. The extension of the SAGE tag file is *.stf (sage tag file).
Extract from Ditag-sequences - Before extraction, the ditag sequences must be loaded into a
SEQtools project and a master ditagfile (*.dtf) must either be created (empty) or an existing ditag list opened. You
also have to enter an expected maximum length of a ditag (2 x anchor length + 2 x tag
length + a few more to allow for the variation of the type II enzyme) and select a file
name for the SAGE tag file.
Starting at the 5' end of each sequence in the project, a region delimited by two
anchor sequences is isolated. Then the length of the ditag is checked to see if two full
length tags can be extracted and if the ditag is shorter than or equal to the specified
maximum length.
If these checks are passed, the ditag sequence is compared to ditags in
the master list containing all previously extracted ditags and rejected if it is already
in the list. If this check is also passed, the left and right tags are isolated. The
downstream tag is converted to its complement. If the tags are free of N's they are
included in the raw tag list.
When all ditag files of the project have been extracted, a unique/processed SAGE tag
list is constructed. The number of copies of each unique tag is recorded and the processed
tag list is saved as a *.stf file. The *.stf file is sorted according to the number of
tags. The updated master ditag list is also saved as a *.dtf file which includes all
unique ditag sequences and their length.
Format of Sage Tag File (*.stf): The file contains a text header including the information indicated in the
example below and a tag list where each line includes the tag sequence (without the
anchor), the number of times the tag was found and the origin of the tag (clone name for
tags extracted from sequences in a project or accession number for non-SEQtools generated
Genbank multi-sequence files). The maximum length of the origin field is 12 characters.
Excess characters are truncated without warning. The origin information is not recorded
for tags extracted from ditag sequences.
The header and the tag list are separated by the standard SEQtools divider: CR+LF + ..
+ CR+LF. The fields (= words) in each record (= line) are separated by tabs, chr(9).
Records are separated by CR + LF.
File types generated by the SAGE extract function:
MTF - Minimal sage Tag File (NCBI): Is a plain text file including the tag
sequence (without the anchor) and the number of times the tag was found. The tags are
sorted alphabetically. The fields (= words) in each record (= line) are separated by tabs.
The same format is used by NCBI for downloadable sage data files.
SMF - Sage Mapping File (NCBI): Is a plain text file including the tag
sequence, a clone/accession number and a gene name derived from a gene bank multi-sequence
file or from the headers of sequences contained in a project. The fields (= words) in each
record (= line) are separated by tabs. The same format is used by NCBI for downloadable
SAGEmap reliable mapping files.
DTF - sage DiTag File: Contains a header including the information indicated
in the example below and a Ditag list including the ditag sequence and length. The header
and the ditag list is separated by the standard SEQtools divider: CR+LF + .. + CR+LC. The
fields (= words) in each record (= line) are separated by tabs, chr(9). Records are
separated by CR + LF.
LST - LiST file: A plain text file to be viewed with a text editor.
PSP - Project Load Path file: Contains the full paths (to where the files were
loaded from) of all files/sequences yielding a sage tag. This file can be read by SEQtools to
load the referred files into a project.
An example of a STF file:
	PROJECT		Tags extracted from GENBANK.FGF
	FILE NAME		Tags from genbank.stf
	DATE		12-02-98    23:09:51
	ANCHOR		CATG
	LENGTH		10
	NUMBER		516
	DUPLICATES	608
	..
	GGATTCATGG	47	;X234765 ;D244765 ;H986556
	ACGATTCGTT	43	;R223545 ;A445678
Screenshot of the Extract SAGE tag form. The options under the different tabs are explained in
the text section above.
4.12.2.2 Sage tools - This form contains a collection of functions for modifying and comparing SAGE
(sequence analysis of gene expression) tags files.
The SAGE analysis of gene expression is a very powerful method of studying gene
expression, especially if you are interested in differences in expression patterns at two
different stages of the cell cycle. When SAGE tag files are available for both stages, the
functions included here allows you to find genes expressed at either or both stages. The
query server makes it easy to retrieve the data base entries for relevant genes.
All functions included in the SAGE tools require that two SAGE files are loaded and
that the two files are compatible, i.e. that anchors and tag length are the same for both
tag files. Processed files can be saved/exported in default SEQtools format (*.stf) or
NCBI minimal format (*.mtf).
Processed files, i.e. where the numbers of tags are replaced by frequencies or
percentages, cannot be used in further comparisons but are intended only for searching
sequences loaded into SEQtools projects. The default extensions for processed tag files
are *.pst.
File menu - The file menu contains the usual items. SAGE tag files can be loaded/imported and
saved/exported in default SEQtools format (*.stf) or in NCBI minimal format (*.mtf).
Edit menu - enables you to save the histogram as a graph file. The histograms can be copied to the clipboard
either as a *.bmp or a *.wmf image.
Function menu - The Function menu contains five functions processing pairs of SAGE tag files in various ways.
If a function does not return a result a an error message is returned. This may for example occur if you
attempt to subtract a two tag lists and all entries in one of them are included in the other - or if you look for
common tags between two files that do not have any tags in common.
If common tags of two SAGE files have been extracted with the Common in first and last function, the
frequency/percentage is calculated separately for the contribution of each
of the two original files and the result shown in the histogram in different colors.
Graph options - This allows you to select how many sage tags to include in the graphics display or
when printing the distribution histogram.
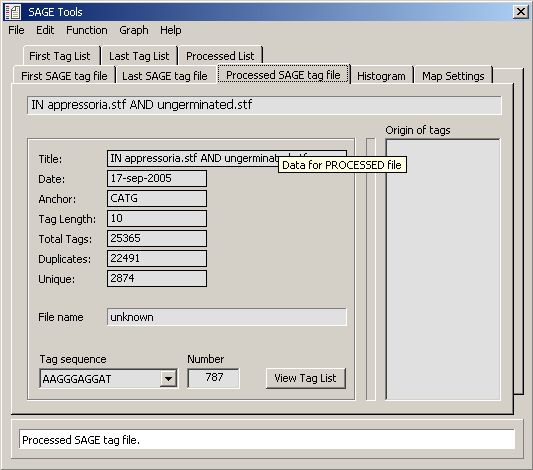
Below are screenshots showing the content of the different tabs of the SAGE tools form.

Histogram displaying the distribution of tag frequencies for the first tag file.
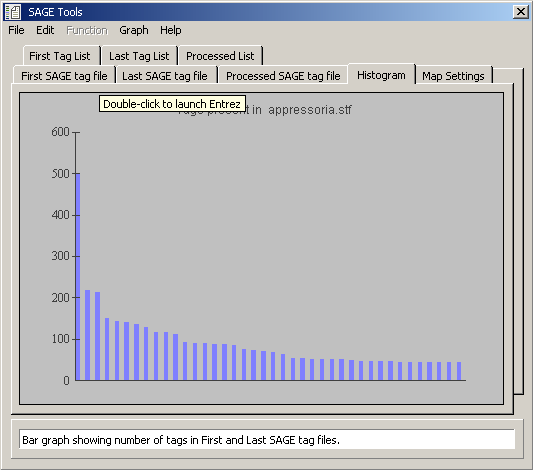
Distribution of tags present in both loaded tag files.

Data tab for the histogram displayed above (tags present in both loaded tag files).
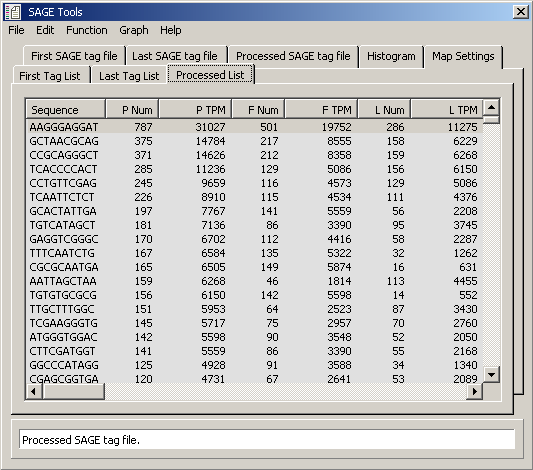
Data table for tab for processed tag files shown above. (P Num = total number of tag present
in both tag files; P TPM = tags per million for total tags present in both tag files;
F Num = number of tags in first tag file; F TPM = tags per million for first tag file; L Num = number of tags
in Last tag file; L TPM = tags per million for last tag file)
SAGEmap reliable mapping file - In order to take advantage of the annotation options for the tag source
sequences you have to create/download a SAGEmap (*.smf) file and use the data in this file to identify the genes
corresponding to sage tags as described above under the Extract SAGE Tags function.
Basically, a mapping file is a tab delimited ASCII file containing the tag sequence, a unique gene identifier/clone
name and an annotation line/gene name.
Mapping files for several organisms can be downloaded from NCBI for Homo, mouse, rat and S. cerevisiae.
In cases where you work on a different organism a mapping file can be constructed on the basis of an annotated EST
library or from a FastA multi-sequence file. SEQtools includes functions to create SAGEmaps from both
data types.
In case a FastA multi-sequence file is not available it can be generated with
the Local Database Function.
Example of a SAGEmap reliable mapping file
	AAAAAAAAAA C00196-R heat shock protein 70 [Trichophyton rubrum] 2e-16
	AAAAAAAAAA C00224-F protein associated with DNA helicase/prim 6.0
	AAAAAAAAAA C00280-R hypothetical protein Rv2052c [Mycobacte 0.37
	AAAAAAAAAA C00822-M HYPOTHETICAL 24.1 KD PROTEIN C17A5.08 IN CH 9e-19
	AAAAAAAAAA C01407-R No description list for sequence C01407-R.
	AAAAAAAAAA C0A12-1R mucin, tracheobronchial - dog >gi|402558|emb|CAA4891 8.5
	AAAAAAAAAA D00131-F No description list for sequence D00131-F.
	AAAAAAAAAA D00369-F 64aa long hypothetical protein [Aerop 0.008
	AAAAAAAAAA D00428-R No description list for sequence D00428-R.
	AAAAAAAAAA D00470-M No description list for sequence D00470-M.
	AAAAAAAAAA D00581-F HEAT SHOCK PROTEIN HSP1 (65 KD IGE-BINDING 6e-44
	AAAAAAAAAA D00599-M No description list for sequence D00599-M.
	AAAAAAAAAA D00620-F TYPE II DNA MODIFICATION ENZYME (METHYLTRA 0.36
	AAAAAAAAAA D00762-M HYPOTHETICAL 37.2 KD PROTEIN IN ALG9-RAP1 I 6e-04
	AAAAAAAAAA D00818-F No description list for sequence D00818-F.
	AAAAAAAAAA D00837-F PUTATIVE GLUCOSYLTRANSFERASE C08H9.3 >gi|38 6.3
	AAAAAAAAAA D00940-M endonuclease [Magnaporthe grisea] 5e-53
	AAAAAAAAAA D01107-M A2-5a orf23; hypothetical protein [Ba 1.7
	AAAAAAAAAA D01268-F GTP-binding protein ypt5 - fission yeast (Schizosacc 2e-12
	AAAAAAAAAA D01294-M glyocprotein [Vesicular stomatitis virus] 9.5
	AAAAATCTTG D00950-M LONG-CHAIN-FATTY-ACID--COA LIGASE 3 (LONG-C 7e-10
The SAGEmap list includes the tag sequence, a description of the gene with the tag sequence in the
3'-most end of the sequence and the expect value for the match.
4.12.2.3 Expression analysis - This utility allows you to compare up to six SAGE tag files generated
with the same anchor sequence. The result of the comparison is displayed either as a histogram or as data
text output in the form of tables of frequencies or origin of tags. The frequency tables
are formatted so they can be imported into a spread sheet for further processing. The
function works with SAGE tag files generated by SEQtools, extension *.stf (Sage Tag File)
or tag files imported in *.mtf format (NCBI).
This function furthermore enables you to analyse if tags included in a particular tag
file are more or less frequent than the tags contained in the first file loaded. In other
words to see if a given gene - represented by a SAGE tag - is up- or down regulated
relative to its expression at the stage where the SAGE tags in file 1 were collected.
The options included with this function may seem complicated but with a bit of patience
and practicing you will realise that the function is a quite powerful tool in analysing
the large amount of data produced by the SAGE procedure.
In order to take advantage of the annotation options you have to create/download a
SAGEmap (*.smf) and use the data in this file to identify the genes corresponding to sage
tags as described under Extract sage tags.
The Analysis menu:
Building the Final tag list - The comparison is performed in the following way: File 1 is loaded and is
used to create a Final Processed file which includes the entire content of file 1. When the next file is
loaded, the main file is updated to include only SAGE tags which are also included in file
2. Following tag files are compared in the same way to the final tag file. This implies
that the final tag file, after loading the last file contains SAGE tags common to all
loaded tag files. The main tag file is then sorted by the sum of frequencies for each tag.
Data sets - Include all data sets - This implies that also tags which are NOT present in all loaded
tag files are included in the final file and are displayed in the histogram and included
in the data lists.
Reject incomplete data sets - In this case only tags which are present in ALL loaded
tag files are included in the final file and are displayed in the histogram and included
in the data lists. (default)
Sort order - With this option you can select which of the loaded tag files are used for sorting the
final data. The selected sort option applies both to the histogram and to the data lists.
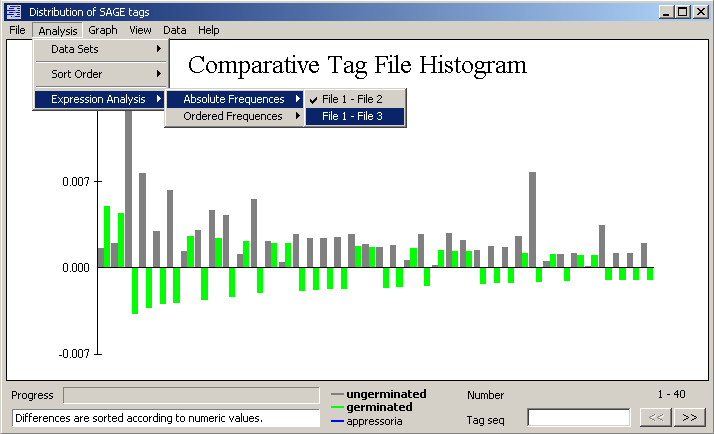
Expression analysis - The expression analysis subtracts the selected file (2 - 6) from the first tag file
loaded. Positive values implies down-regulation, negative values up-regulation. The
differences are either sorted and displayed by their numeric values, Absolute frequencies,
or according to their true value, Ordered frequencies.
The Graph menu:
Tags per page - Sets the number of data sets displayed per histogram page. The Page Up, Page Down, Home
and End control the navigation between pages. When expression analyses are displayed, the
first time Home or End are pressed, the display moves to the border between positive and
negative differences. The second time, the it jumps all the way home or to the end. The
range of data currently displayed is shown in the field to the right.
Axes - In this menu you can select whether the histogram is displayed with a fixed scale
of the Y-axis or if the Y-axis scale is adjusted for each page of the histogram. The
latter option is convenient when you want to enlarge small differences between tag
frequencies. The Labels option allows you to turn on or off labels on the X-axis.
Color pattern - Allow you to select a number of color patterns for the histogram display. The options in
the Visual Basic graph engine are not overwhelming but it is possible to get different
colors for all six data sets.
Graph title - Makes it possible to change the font size within limited ranges. The graph engine makes
sure that the selected size matches the displayed histogram - and adjusts if necessary. You can also enter a title
for the histogram.
The Data menu:
Summary loaded files - Lists a summary of all loaded SAGE tag files
Frequency, histogram/entire file - Builds a compressed tag list either for the range currently displayed
or for the entire data set. The data can be loaded into a spreadsheet for further processing.
Origin, histogram/entire file - Builds an annotated tag list if sequence header data are available.
The list either includes the range currently displayed or the entire data set.
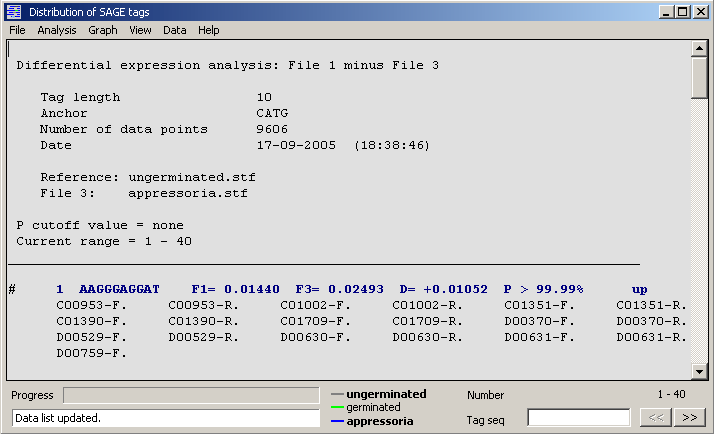
Differential expression, histogram/entire file - Builds an annotated list containing frequencies for tag
file 1 and the difference between file1 and the selected tag file. Down-regulated tags/genes are denoted
by ( - ) and up-regulated by ( + ). With the cutoff option in the data display menu, the number of data
sets can be reduced.
Data display options -
Clone names - Uses clone names in the data lists instead of sequence header lines
Gene names - retrieved from a SAGEmap file
Clone and Gene name - retrieved from a SAGEmap file
Cut off limit - This option is only active when tag files are compared (expression analysis). Truncates the data list according to the set cut off value. The limit is calculates as a percentage (5, 10, 15, 20, 25, 30) of the numerically shortest Y-axis. Include all, sets the cut off value to zero, i.e. no limit. The cutoff limit is based on statistical analyses of the tag frequencies in the two profiles.
Graphical display of a comparative sage tag histogram.
An example of the data display for a SAGE tag expression analysis (tag file 1 minus tag file 3).
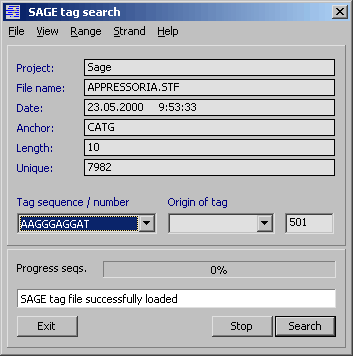
4.12.2.4 SAGE tag search function - The SAGE search function is designed to search all sequence
files currently loaded into a SEQtools project with a list of SAGE tags.
Before starting a search, a SAGE tag data file *.stf or *.ptf must be loaded into the search program.
Prior to opening the data file, enter the length of the SAGE tags.
All tag sequences are validated (only ACGT are allowed) and compared to the specified
length. Tags of different length and/or containing illegal characters are rejected during
loading the SAGE tag data file.
If you want to include a part or all of the anchor sequence in the search, type the
bases you want to include in the Anchor sequence field.
Select in Strand if you want to search both strands, the Watson or the Crick
strand of the sequences in the project.
The output of the search is displayed on a separate form and includes the sequence
name, the tag number, ID and sequence. The anchor sequence is separated from the tag
sequence by a / . In the View menu of the result form you can specify a header line (line
1 to 5) and instead see the result as a list of the specified header lines.
Double clicking a line in the results list retrieves the header of the corresponding
sequence. Closing the header form brings back the SAGE analysis result list. Messages to the
user are displayed in the infoline at the bottom of the analysis form.
 4.12.3 microarray tools
The functions described below are designed to construct and handle oligonucleotide based microarray
analyses of gene expression. The first function is used to index oligonucleotides stored in 8 x 12 well microtiter
plates (MTP). The second function is used to build microarray project files (MPF) combining from sets of
oligonucleotides in microtiter plates.
The first function is designed to assist you in
creating an index file (MicroTiter Plate, MTP) for sequences/oligonucleotides contained in a
96-well microtiter plate.

4.12.3.1 Microtiter plate index files - The microtiter plate file (MTP) is a multi-sequence file containing 96 individual oligonucleotides and
their annotation. Each sequence (or blank) is assigned an unique position identifier, A01 - H12,
corresponding to its location in a 96-well microtiter plate.
Nucleotide sequences with or without annotation
must be loaded into a SEQtools project to be included in the MTP file. If more
than 96 sequences are loaded into the project, only the first 96 are
automatically included in the MTP file. Loading less than 96 sequences into the
project causes the function to add blanks (sequences consisting of a single N
and no annotation) to reach a total of 96 entries.
Follow the steps below to create a new MTP file from a collection of sequence or primer files.
How to create a MTP file - Load the files you wish to include in the MTP file into a normal nucleotide
SEQtools project.
You can load more that the required 96 files or less if you prefer to include blanks -
or if you do not want to fill the microtiter plate completely.
If you load a large number of sequences into SEQtools, it is sometimes preferable to isolate a smaller sub-group by
selecting some of the files and launch a new instance of SEQtools including only the selected files.
In the next step you assign a sequence or a blank to each of the 96 microtiter plate positions:
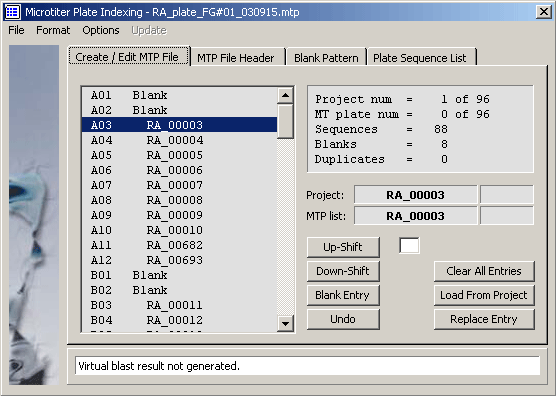
- - Open the Special/Microtiter Plate Indexer and click the Create/Edit MTP File tab.
- - All microtiter plate 96 positions are already filled with blanks.
- - Navigate in the main SEQtools Editor or the Header form to the sequence you wish to insert.
- - Highlight the insert position in the MTP list by clicking the line.
- - Click Replace Entry to insert the selected sequence at the specified MTP location.
- - Double-clicking a line containing an entry removes the name from the list by inserting a blank.
- - If project contains the sequences you wish to include in the correct order you can just click Load
From Project to automatically fill the MTP list. - - When you are done, fill out the MTP file header and save the MTP file, File/Save/Microtiter Plate File.
A 6-digit checksum - is generated after joining, in the correct order, all nucleotide sequences included
in the MTP file. When the same file is opened, the checksum is re-calculated and the two
checksums compared. If the checksums differ - indicating that the MTP file has
been altered since it was saved - a warning is issued.
FastA definition lines - When a MTP file is imported into a microarray layout design project, the
information included in the ImaGene GeneID file is retrieved from the fasta definition lines of the sequences
contained in the MTP file. To ensure correct parsing of the fasta definition line it is essential that it is
correctly formatted.
Make sure that the definition lines contains the following number of words in the correct order. Each word must be
separated by a single space. The last part of the definition line, the gene description may contain additional
words, but must be the last of the fasta definition line. The FastA definition line should contain the following
information:
- - word 1 = accession number
- - word 2 = primer ID
- - word 3 = plate number
- - word 4 = position in microtiter plate + position in microarray (e.g.,pos:A01-1.1.1.1)
- - word 5 = species name
- - word 6 = description
Currently only word 1, word 2 and word 6 are used by the microarray layout design function. In cases where information for a certain word is missing, just use a spacer (a dash) to maintain the correct number of words. The FastA definition line editor can be used to compose correctly formatted definition lines. Examples:
	>NM_56736	 PQGTHIL.SEQ #2 pos:A2-1-2-4-5 Rat Glyceraldehyde-3-phosphate dehydrogenase
	>NM_56736 PQGTHIL.SEQ #2 pos:A2-1-2-4-5
	>None     PrimerID - - - Rat Glyceraldehyde-3-phosphate dehydrogenase
	>NM_56736 - - - - Rat Glyceraldehyde-3-phosphate dehydrogenase
The MTP multi-sequence file includes the full nucleotide sequence and annotation for each included
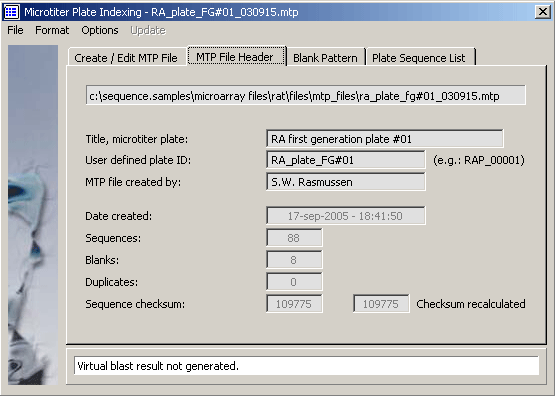
sequence. The MTP file header (separated from the body by a "&&" divider) contains
the following information:
- - Title of the microtiter plate
- - A user defined plate ID
- - Name of the author
- - Date and time of creation
- - Number of entries (processed entries)
- - Number of blanks
- - Number of duplicates
- - A unique checksum for the sequence content of the MTP file
Existing MTP files can be loaded into SEQtools either as standard multi-sequence (MS) files via the
normal File/Open... functions or by the Special/Microarray Tools/Microtiter Plate Indexing function. Only in the latter
case is the MTP file header read and displayed by SEQtools.
Opening MTP files - Only correctly formatted MTP files with a *.mtp file extension can be opened by this
function.
When an existing MTP file is opened, the content of the file header is displayed in the various fields and the sequence
checksum is calculated and compared to that generated when the file was saved.
The sequences and their headers contained in the MTP file are loaded into SEQtools in the same order as they were
saved. The file list in the Create/Edit MTP File tab is updated with the new information.
Editing MTP files - Remember that only files contained a SEQtools project can be added to a MTP file. If the
sequence you wish to include in your MTP file is not a member of the current project you can append new files
to an existing SEQtools project using File/Add Files To Project. Also note that the number of sequences in an MTP
file is fixed to 96. This implies that inserting a sequence or a blank at same time removes another sequence
or blank.
Undo - The last 10 operations can un-done by clicking Undo.
Replace - Highlight the sequence you want to replace in the MTP list. Navigate in the SEQtools project to the
sequence you wish to use as the replacement. Click Replace Entry.
Insert - Make sure that the last sequence in MTP list is dispensable. Highlight the position below the insertion
point. Down-Shift the MTP list from the insertion point to create a blank position. Replace the blank position with
the sequence from the current project to be inserted.
Remove - Double-click an entry to replace it with a blank without altering the coordinates of the
remaining entries of the MTP list.
Up-shift list - Move all entries downstream of and including the highlighted entry one line up. Adds
a blank at the end of the MTP list to maintain the fixed length of 96 entries.
Warning: the coordinates of all entries downstream of the removed entry are changed by
this operation.
Down-shift list - Move all entries downstream of and including the highlighted entry one line down.
Inserts a blank at the free line to maintain the fixed length of 96 entries.
Warning: the coordinates of all entries downstream of the removed entry are changed by
this operation.
Clear all - Removes all entries from the MTP list.
Load from project - Loads sequences contained in the current SEQtools project into the MTP list. Loading
starts with the first sequence in the project and ends with sequence 96. Blanks are added as required to maintain a
fixed list length of 96.
Warning: This operation cannot be un-done.
Remember to save the MTP file after editing.
Checksum - A 6-digit checksum is generated after joining, in the correct order, all nucleotide sequences
included in the MTP file. When the same file is opened, the checksum is recalculated and the two checksums compared.
If the two checksums differ - indicating that the MTP file has been altered since it was saved - a
warning is issued.
Screenshots of the different tabs of the Microtiter Indexing form are shown below:
The microtiter plate Create/Edit tab.
The MTP file header editor.
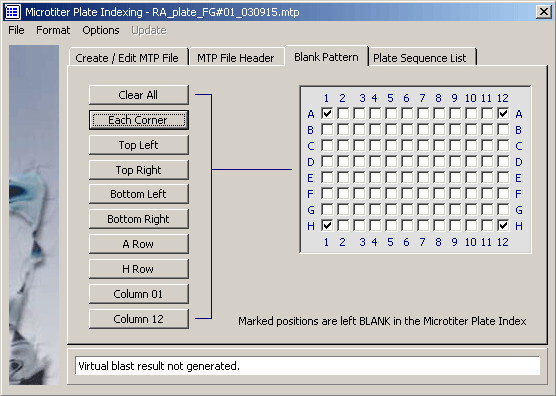
The microtiter plate template.
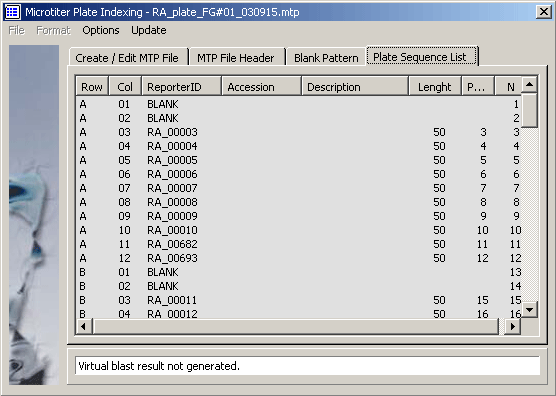
The microtiter plate sequence list.
4.12.3.2 Microarray design function - This function includes facilities to combine
multiple microtiter plate files into a microarray layout project.
The function generates, on the basis of the selected MTP files a GeneID file containing the coordinates to
each spot in the microarray, the accession number of the gene from which the oligo nucleotide was
derived and a short description of the gene. The GeneID file can be read by the ImaGene image analyser.
IMPORTANT: In calculating spot coordinates it is assumed that the microarray will be
printed by a Affymetrix GMS 417 arrayer equipped with a 4-pin printing head having a pin-to-pin distance
of 9 mm. The layout should be generated by the GMS 417 "AutoGenerate Tool" in "Horizontal"
mode with the "Dot Spacing" for both X and Y set to the value used by SEQtools to generate the microarray
layout.
WARNING: Setting the dot center-to-center distance in the GMS 417 arrayer to a
different value than the one used to generate the layout in SEQtools may result in a different number of
plates per row before wrapping to the next row. Obviously this will disrupt the association between dot
coordinates and Gene ID.
How to create a MPF file:
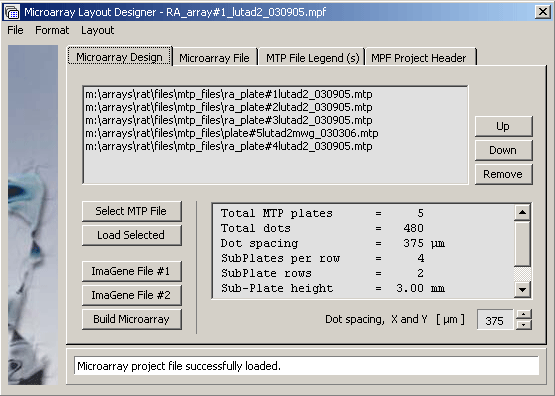
- - On the Microarray Design tab use the Open MTP File command button to select the microtiter plate files (MTP files)
you wish to include in the microarray. - - If you want to remove a MTP file from the list just double-click it.
- - Then click Load Selected to create a new SEQtools project containing the selected sequences.
- - You can view the headers of the loaded MTP files on the MTP File Legend(s) tab.
- - Click Build Microarray, ImaGene File #1 or ImaGene File #2 to compose an index file including information from
all MTP files comprising the microarray project. - - Use File/Save As/... to save the microarray index files in the specified format.
Gene descriptions, Options - The two menu items under the Options menu allow you to choose a
blast header section to supply the information for gene descriptions. The second menu item, brings you to description
line formatting options. Remember to rebuild the microarray or imagene file to refresh the content after altering
gene descriptions.
Save microarray projects - Once the microarray project is completed you can save the entire project as a
multi-sequence Microarray Project File (*.mpf)
Save ImaGene GeneID file - Data files for the ImaGene image analyser can be saved in either of the two
formats (#1, #2) described in the ImaGene manual.
Open microarray projects - Microarray project files, *.mpf, can then be re-opened at a later stage for
editing or inspection of the data associated with the microarray layout.
About printing - Project reports consist of a project page followed by one page per MTP file containing
in a 12 x 8 format the file names of the 96 sequences contained in the MTP file.
Displayed microarray list - This print option simply prints the currently displayed ImaGene List /
sequence list.
WARNING: Keep in mind that microarray layout project files (*.mpf) can be
very large
Screenshot of the Microarray design tab illustrating how a project is - in this case - composed from five microtiter plates.
The Microarray oligonucleotide project file.

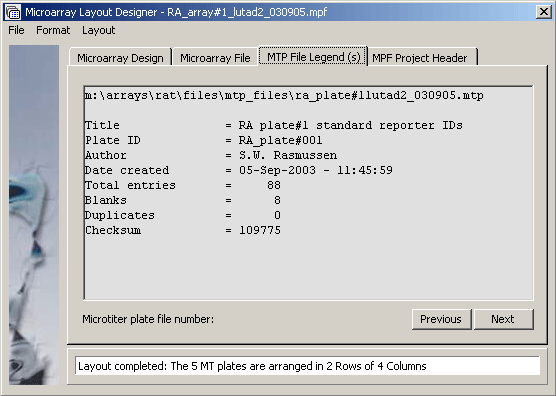
The microarray project file legend displaying the header for MTP file RA_plate#001. Clicking Next or Previous navigates between the five microtiter plates.
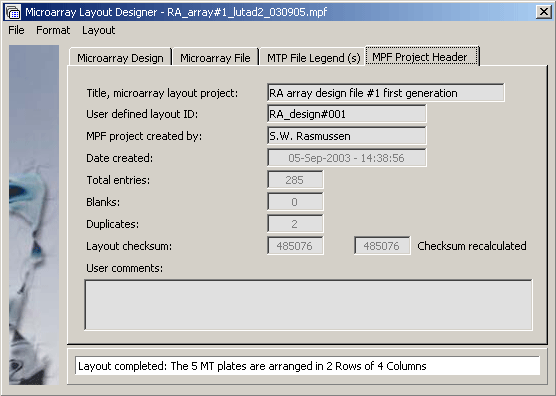
The microarray project header tab.
As described above there is an intimate relationship between microarray design and the SEQtools project containing the nucleotide sequences for all oligonucleotides used in the microarray project. The main advantage is that the search/annotation facilities of SEQtools can be utilised to verify/characterise the oligonucleotides to be used in the microarray.

The project sequence list for a microarray SEQtools project.
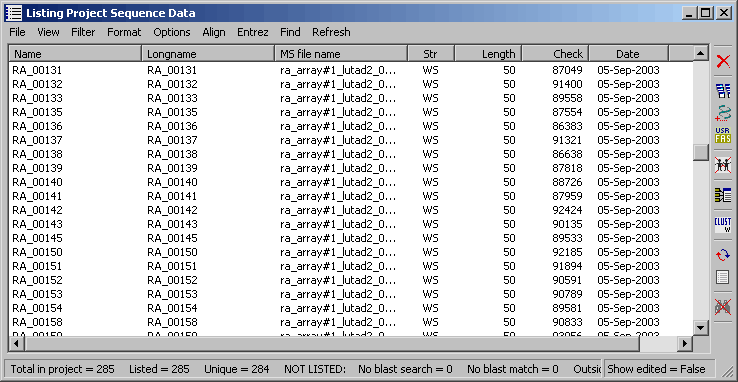
Using blast search results for the sequence list provides an easy way of getting an overview of the involved genes used to construct the microarray.

 4.12.4 multi-record text file parser
This utility is designed for extraction of defined records from a downloaded multi-record text file, for
example from a Locus Link search.
The saved result text file from a search like this is not immediately suited for retrieval of the sequences found by the
search. By using the SEQtools parser is is possible to extract up to 8 lines from each record of the original text file
and combine them into a new well defined multi-record file.
By using the "Mandatory" option the parsed text file can be filtered to exclude incomplete records.
Using this parser makes it easy to build an input file for batch Entrez retrieval of the actual nucleotide or protein
sequence records.
Parsing record lines, Record Mode - Parsing with these settings extracts records consisting of the LOCUSID:
line + information from NM: and NP: lines. The Line ID keys are removed and only records
containing all three lines are included in the parsed file.
Parsing individual lines, Line Mode - With the setting illustrated above each of the
first words of all lines in the raw text file is removed and all lines are truncated after character 60.
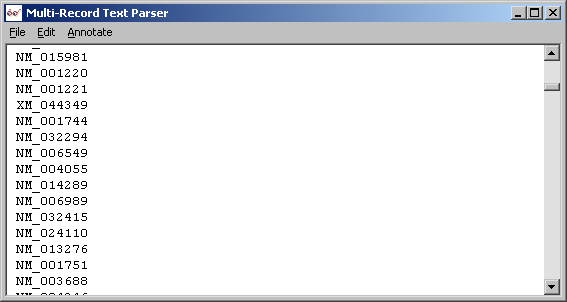
Three steps in converting a downloaded flatfile from Locus link to a accession number list suitable for batch retrieving
sequence records from Entrez are:
- Download the locus link flatfile
- LOCUSID lines extracted with record parser
- Trimmed accession number lines with line parser
Parsing with these settings extracts records consisting of the LOCUSID: line and information from NM:
and NP: lines. The Line ID keys are removed and only records containing all three lines are included in
the parsed file
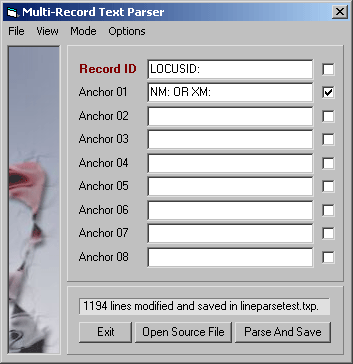
With the setting shown above each the first word of all lines in the raw text file is removed and
all lines are truncated after character 60. The three steps in converting a downloaded flatfile from Locus link to a
accession number list suitable for batch retrieving sequence records from Entrez are illustrated below.

Original downloaded locus link flatfile.
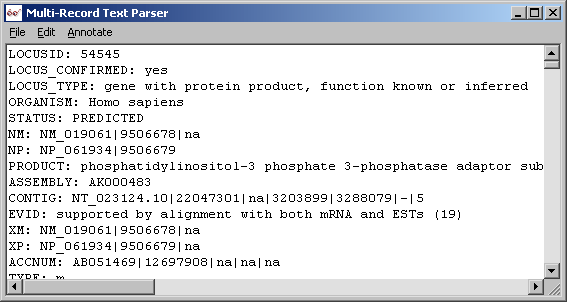
LOCUSID lines extracted with parser in Record mode.

Trimmed accession number lines with parser in line mode.
© 2002-2010S.W. Rasmussen (revised: )